Burndown reporting
May 2, 2020 · 7 min readIf you’re happy with the automated burndown reports from tools like Jira and Azure Devops, then this post is probably not for you (except maybe the CLI tools section). If you prefer to manually generate a burndown report, or use a tool that doesn’t have that feature built in, then read on.
My first foray into the world of work management tools starting about 13 years ago, and my team used Trac. At the time, if my memory is correct, it did not produce a burndown report. A colleague of mine, Stuart Smith introduced me to a manual spreadsheet burndown report, which I’ve tweaked and used pretty much ever since.
I heavily used Trello for about 6 years with one of my teams at work, and loved it! Trello did not create a burndown report out of the box. This meant I got into the habit of writing CLI tools that helped pull data from Trello and produce reports that my manager wanted to see. This tool chain concept carried on to future work management systems.
CLI Tools
The list of tools I’ve built over the years to help pull data from work management systems include:
- lionel (Trello) - There is a PHP based version too, which has been deprecated in favour of
lionel - hagen (GitHub)
- walter (Jira)
- donny (Azure DevOps)
They all have a very similar goal:
Pull data from work management systems, in a useful format, so that I can produce reports.
Using lionel as an example, this is what the burndown command will provide:
$ lionel burndown "Sprint 2020.6"
List           Cards Story Points
----           ----- ------------
Sprint Backlog 3     13
Doing          4     8
Stuck          0     0
Review         1     1
Done           2     5
-----          ----- ------------
Total          10    27
-----          ----- ------------
Each tool has other useful commands around issue reporting in relation to a sprint board.
Why a spreadsheet
Normally, I am not keen on completing arbitrary spreadsheets, but there are two main reasons here:
- I can keep the same workflow when companies decide to move Work Management tools, which seems to be more frequent than you would imagine.
- I like to personally review the data going into the burndown.
Point one, I hope, is self explanatory.
Point two is a little more nuanced. I’ve personally worked in teams that focussed more on the automated burndown, as you would expect. What I personally found, was that teams seemed to ignore it. I also found that these teams generally lost focus in a sprint, or struggled to deliver a regular velocity.
I like to review the data at the end of the day, and reflect on what the day involved. It is also part of a winding down ritual I seem to have adopted over the years. Nearly finished work? Review the day, update the burndown, post some thoughts into the Slack channel. It seems closer to the team. It feels more pertinent.
I'd personally prefer to curate a report, so the stakeholders have the same context of the project as the team.
As a personal note, the work management tools I have enjoyed working with have been Trello, and GitHub. In my opinion, both of these systems are perfect from an engineers point of view. They may lack some reporting for programme managers, but that doesn’t mean they are any less useful. It will depend on who you need to report up to, and how much devolved accountability you have. I believe that automated reporting tools lack context and curation from the team. I’d personally prefer to curate a report, so the stakeholders have the same context of the project as the team. This stance will clearly depend on your organisation, and how much it needs to scale.
The spreadsheet can be downloaded in the Numbers version or the Excel version. Disclaimer: I don’t have Excel on my machine, so your mileage may vary. I simply exported from Numbers.
It has two main aspects to it:
- The overview of all sprints for the team/project, with graphs to show trending information.
- The individual sprint reports.
The overview sheet
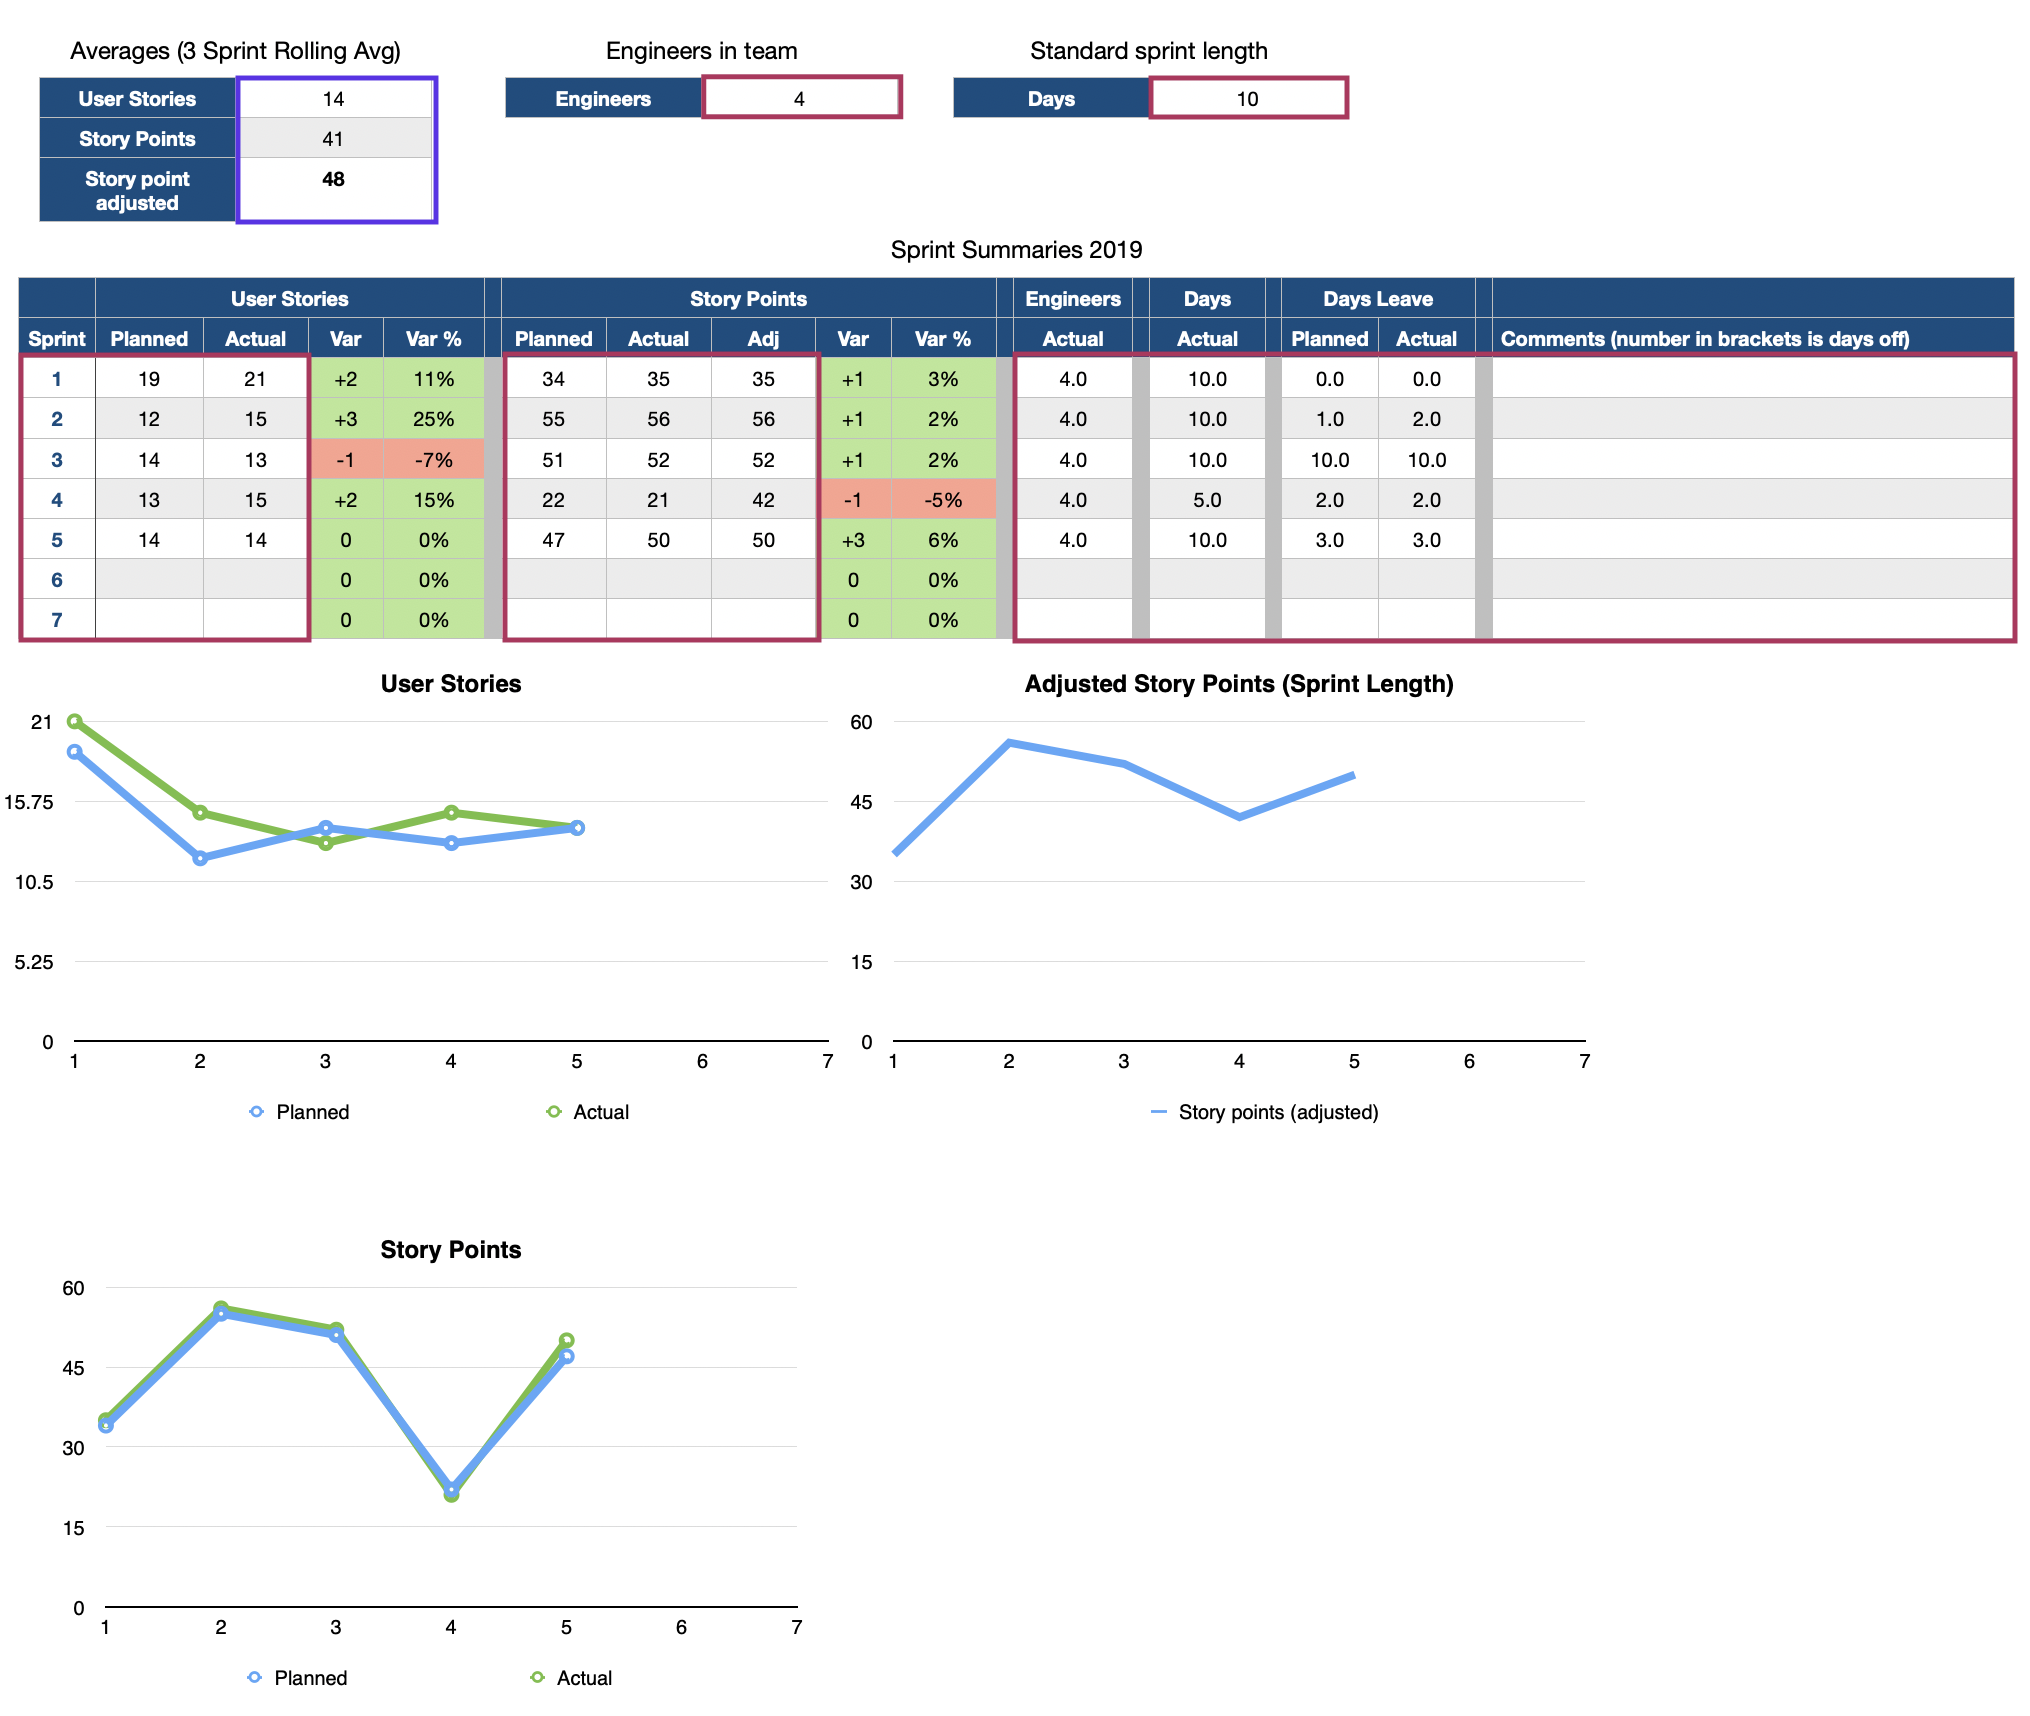
The overview page generates a “3 sprint rolling average” for your velocity. It also has some adjusted values in case your sprint lengths change, or a sprint is abandoned.
I’ve highlighted the areas that you need to complete. The red boxes are for you to complete and are entirely manually. The purple box is a formula that you need to update to get the 3 sprint rolling average. You update these formulas at the end of the sprint. The reason you have to update it, is due to my poor spreadsheet skills. I’m sure there is a formula that would work just fine, but I’ve not looked into it. If you know how to fix this, send me a tweet, and I’ll update it 🤩.
You generally complete this sheet at the end of the sprint.
The sprint sheet
The next aspect of the spreadsheet is the sprint report which you complete daily. It shows you
- The ideal burn rate based on all the data you have supplied. The green line.
- The current burn in relation to the sprint starting point. The blue line.
- The actual burn in relation to what the sprint has currently. The red line.
Points 2 and 3 are in relation to whether your team has to action “Service” work, or you “pull more work in”. This post does not aim to discuss reasoning, but highlight this spreadsheet can cater for those scenarios.
Again, the boxes you need to complete are highlighted in red.
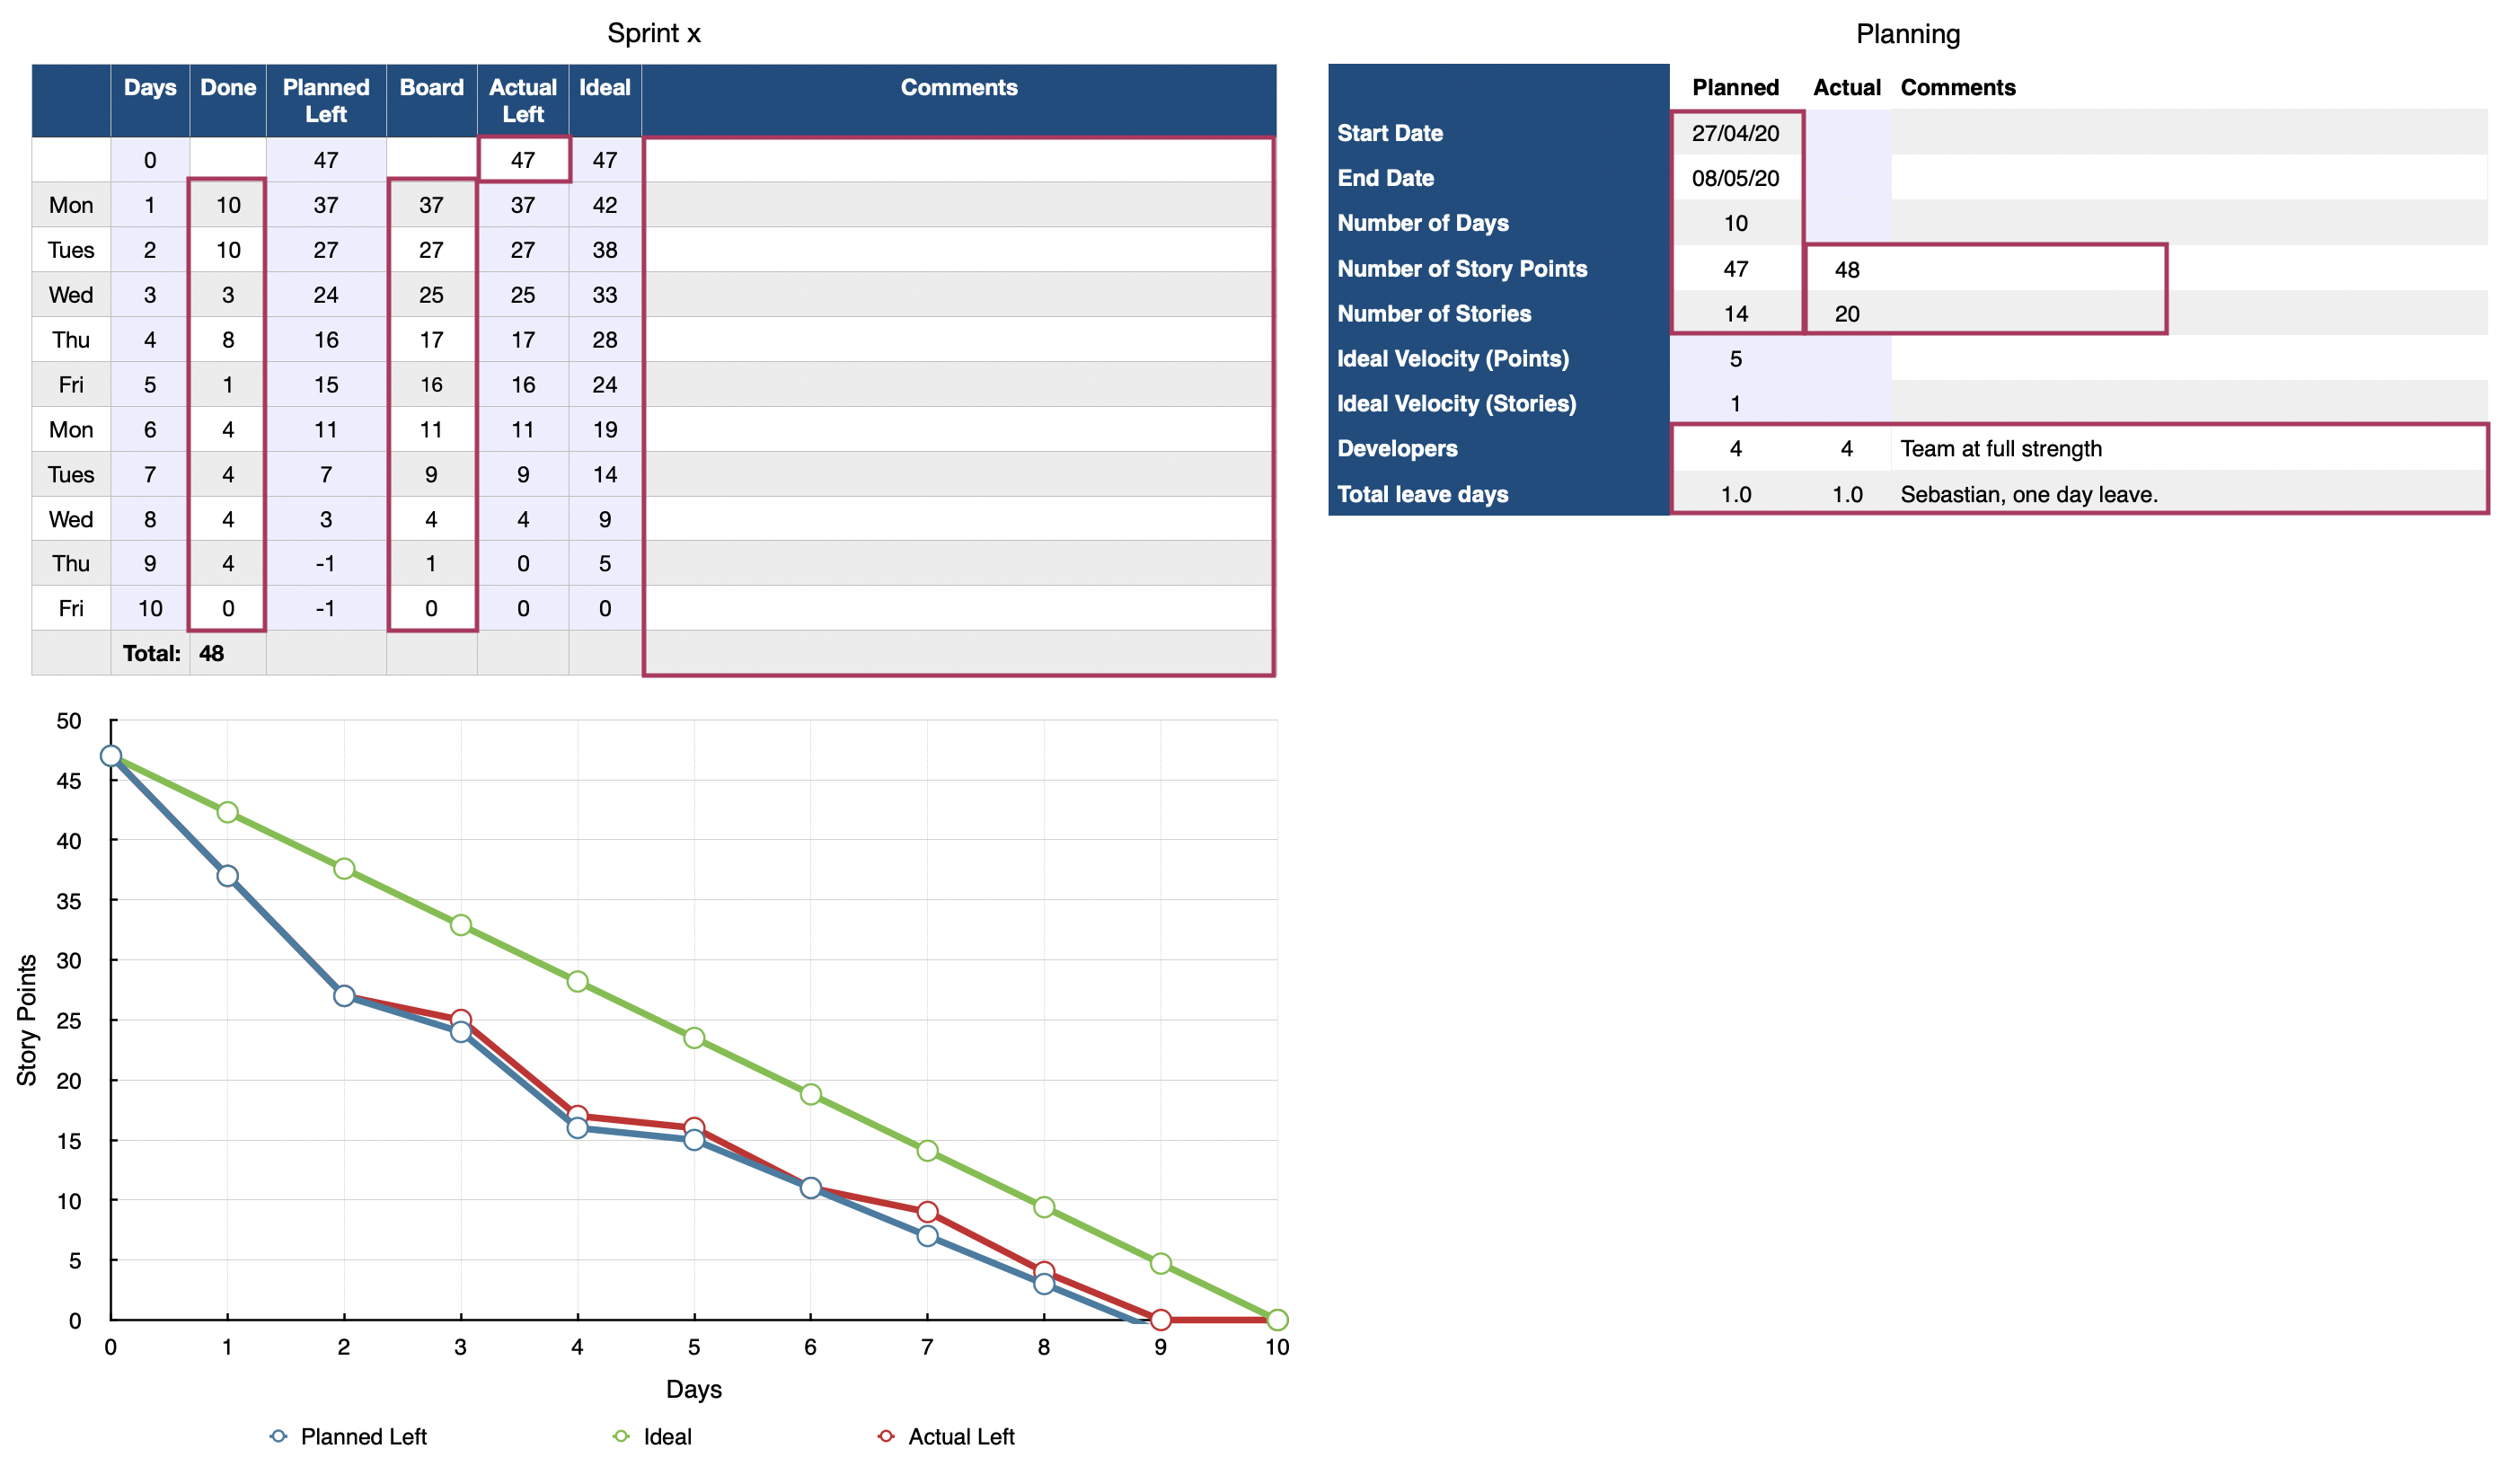
Each day, you can run one of the CLI tools and see the value of what is in the “Done” column (or whatever you agree is “done”). Take the value from here, and calculate the difference from the “Total” column on the sprint sheet (In the example above 48). If the new “Done” value is 52, then yesterday you achieve 4 story points. To get the figure to put in the “Board” column, add all the columns from the CLI tool, and that is the value that is left.
Below tries to annotate this in the lionel command. I’ve removed the data in the “Cards” column for ease of reading.
$ lionel burndown "Sprint 2020.6"
List           Cards Story Points
----           ----- ------------
--8<--
> The number of points left in the sprint is 22.
Sprint Backlog x     13
Doing          x     8
Stuck          x     0
Review         x     1
--8<--

--8<--
> The number of points completed so far in the sprint is 5.
Done           x     5
--8<--
-----          ----- ------------
Total          x     27
-----          ----- ------------
Next level
To take this further, I wanted to call out what I’ve done in the past to help the teams I’ve worked with.
I’ve rigged up the above tooling to a Jenkins instance to email the team and stakeholders on a nightly basis. The tooling mentioned above can produce a text based view of a sprint board. This can help if your stakeholders are further away from your team than you would hope. There have been times when the stakeholders of projects I have worked on did not have access to the work management tools, nor attended sprint ceremonies, but were happy with an email. It’s our job to adapt to the situation we find ourselves in.
This is all about getting the right data to the right people, and for it to feel more relevant.
I’ve also duplicated the overview tables and provided project/backlog reporting information from these tools too. The tools cater for filtering using features in the tool it connects to. For example, using labels in Trello helps pivot the data being displayed.
Conclusion
Hopefully the teams you lead or work in are allowed to use the systems and tools right for them. If so, and this tool set helps, that’s great. Enjoy.